Here is a number worth sitting with.
A software company ran an AI system through rigorous testing. F1 score: 0.94. Near perfect. They shipped it to production. In production, the score collapsed to 0.07.
A 13-fold drop. Between controlled testing and the real world.
If you are evaluating AI tools based on benchmark scores, you are buying the test result, not the product. Those are two different things.
The Benchmark Number Is Everywhere
AI vendors lead with benchmark scores. Model leaderboards update weekly. Press releases cite MMLU, SWE-bench, and HumanEval as though these numbers explain what the AI will do inside your business.
The implication is clear: higher number means better tool. Buy accordingly.
This logic has a flaw. Benchmark scores measure performance in controlled conditions on predetermined datasets. They do not measure performance in your environment, on your data, with your users. The conditions during the test and the conditions during production are almost never the same. The score does not transfer.
Engineers know this. Business buyers often do not. That information asymmetry is expensive.
What Benchmarks Actually Test
A benchmark is a controlled environment. A fixed dataset. Clean questions. A defined answer space. Consistent formatting.
The real world is none of those things.
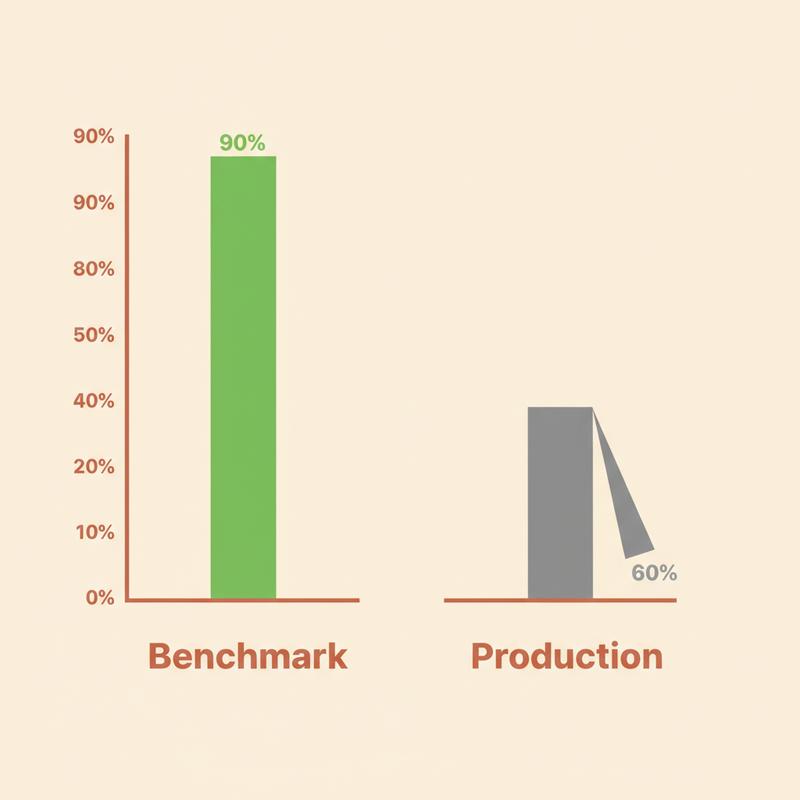
When an AI scores 90% on a benchmark, it means the model answered 90% of questions drawn from a specific dataset correctly. It tells you almost nothing about performance on your data, in your environment, on your actual use cases.
This gap shows up everywhere. Across industries. Across model types. And the gap is large.
Analysis from multiple enterprise deployments shows AI systems typically drop 20-30 percentage points between benchmark scores and production performance. Models scoring 80-90% in controlled conditions frequently fall below 60% in actual deployment. Enterprise AI pilots fail at a stunning rate: some analysts estimate 95% do not survive beyond proof of concept.
The Failure Cases Nobody Highlights
Epic Systems built a sepsis prediction model now used by over 100 health systems. It performed well in testing. Then a JAMA Internal Medicine study examined what happened in actual clinical settings. The model failed to identify two-thirds of sepsis patients who needed treatment, while simultaneously generating thousands of false alerts. Physicians started ignoring it. The tool created noise, not signal.
Google's diabetic retinopathy AI received significant attention when it matched specialist accuracy in controlled trials. Deployed to rural clinics in Thailand, the system rejected 89% of images. The cameras, lighting, and equipment in rural clinics did not match the training data. The model worked correctly on data it had seen. It did not generalize to data it had not.
Legal AI shows the same pattern. Hallucination rates for major legal AI tools run at 17% for Lexis+ and as high as 34% for some implementations. Attorneys have faced court sanctions for citing AI-generated cases with no existence in legal databases. These systems score well on legal reasoning benchmarks. The benchmarks do not test for confidently fabricated citations.
In each case, the benchmark looked great. The deployment did not.
Why This Keeps Happening
Three structural problems drive the gap between benchmark performance and production results.
Contamination. Many widely used benchmarks draw from datasets predating the model's training cutoff. The model has encountered the answers, or problems structurally identical to them, during training. This is benchmark overfitting. SWE-bench Verified, one of the most cited coding benchmarks, uses GitHub issues from before 2023. Models with training cutoffs after that date have often seen these problems. The scores are inflated, not earned.
Distribution shift. A benchmark test environment is clean and controlled. Production environments are messy. Inputs arrive in unexpected formats. Edge cases appear. User behaviour is unpredictable. When the data distribution in production differs from training data, performance degrades. Google's clinic problem was not a capability failure. It was a distribution failure.
Misaligned incentives. AI labs compete publicly on leaderboards. Higher benchmark scores attract investment, press coverage, and enterprise customers. This creates direct pressure to optimize specifically for the benchmark task rather than for general capability. Goodhart's Law at scale: when a measure becomes a target, it ceases to be a good measure.

The Developer Community Is Catching On
r/programming, one of the largest programming communities online with more than 5 million members, ran a trial ban on LLM-generated content in April 2026. This was not an anti-AI stance. It was a response to a specific problem: AI-generated posts and answers were confident, well-structured, and wrong on anything non-trivial.
Developers using AI coding tools daily are discovering the gap between demo performance and production performance. The benchmark says the model resolves 80% of real GitHub issues. The developer in the seat finds a much narrower band of problems where the tool reliably delivers.
LiveCodeBench tests models against fresh competitive programming problems not found in training data. Top models score around 53% on medium-difficulty problems. On the hardest problems, where human experts do well, the top models score 0%.
The same models score 90%+ on older benchmarks.
Math Olympiad problems tell a similar story. AI models score under 5% accuracy on unseen Olympiad problems despite performing strongly on standard math benchmarks. The benchmarks test recall and pattern recognition. Novel problems require reasoning. Those are different skills.
What to Measure Instead

Benchmark scores tell you what a model scored on someone else's test. They do not tell you what the model will do on your work.
Here is what to measure instead.
Build your own evaluation set. Draw it from your own data, your own edge cases, your own failure modes. Run candidate AI systems against those. A model scoring 95% on a public benchmark and 60% on your actual tasks is a liability dressed as an asset.
Test confidence calibration. A well-calibrated model knows what it does not know. Models producing high-confidence wrong answers are dangerous in any domain where errors carry consequences. Track whether high-confidence outputs are accurate on your specific data.
Look at the tail. Average performance hides the failures worth worrying about. A model scoring 90% overall and 0% on a specific input type or user group is a risk, not an efficiency gain. Find where performance collapses before your users do.
Red-team before you ship. Actively try to break the system using domain knowledge specific to your context. Find the failure modes in testing. Your users will find them in production if you do not.
Update your evaluations regularly. Benchmarks go stale. Your evaluation set should reflect current data distributions and current failure modes, not a snapshot from 18 months ago.
Ask Vendors the Hard Question
Next time an AI vendor leads with benchmark scores, ask one question: how does this perform on data we collected in the last three months, on our specific tasks, in our environment?
If they cannot answer, the number they showed you is a marketing figure. Not a performance figure.
The benchmark problem is not going away while labs compete on leaderboards. Your job is to look past the score and test what matters: whether the tool works, in your context, on your problems.
What AI deployment failure caught you off guard after a promising demo?